Tutorial collection
A step-by-step tutorial explaining how to use SUBA is available here:
SUBA Tutorial 
Version SUBA5 for using web portal access https://suba.live
SUBA5 home page 
Top navigation buttons 
The very top of the SUBA5 homepage contains the welcome to SUBA5 banner and top hierarchy navigations buttons. The “All about SUBA5” button leads to a broad overviews of data and services contained in SUBA5. The “SUBA5 home” button gets you back to the home page from any other page in SUBA5. The “go to SUBA3” button leads to you to SUBA3 for finishing or checking work that was performed during the transition into SUBA5. About 12 months after introduction of SUBA5, SUBA3 will be decommissioned.
SUBA5 function menu 
The SUBA5 functions are found underneath the banner and contain access points to the SUBA5 query builder (search) and web services (toolbox). Once a search query has been submitted the user will be guided to the “results” tab for viewing the query hit list. Other areas useful for users include the help and home.

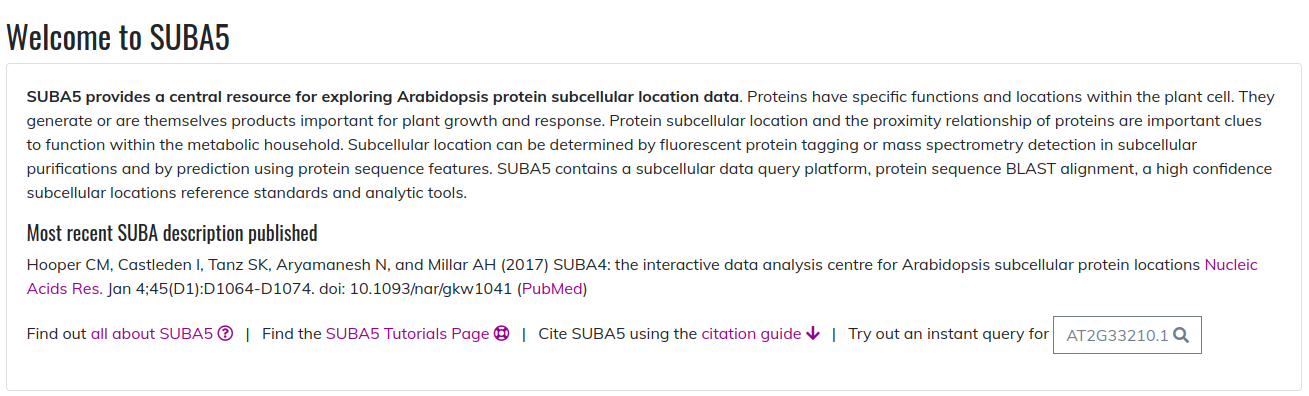
The “What is SUBA5?” information box 
The top information box on the home page gives a broad introduction to what SUBA5 is about and provides the link to the “all about SUBA5” site where users can find more information. You also find the link to the tutorial site, where there is a collection of tutorials about how to use different functions and services provided through the SUBA5 portal. The third link provided is leading the user to a citation guide explaining how to appropriately cite different data and services in downstream studies and applications.
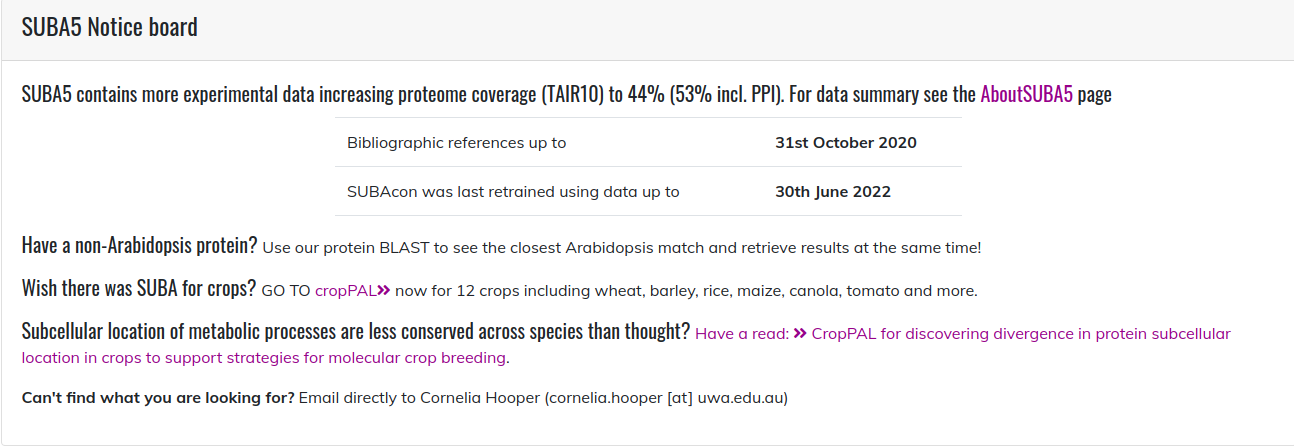
The SUBA5 notice board panel 
The SUBA5 notice board contains important upgrades and news concerning SUBA. For releasing SUBA5 these news included the novel inclusions of tools and localisation data. It also indicates when experimental localisations were last updated and what data was used to train the SUBAcon version that is currently connected to the website.
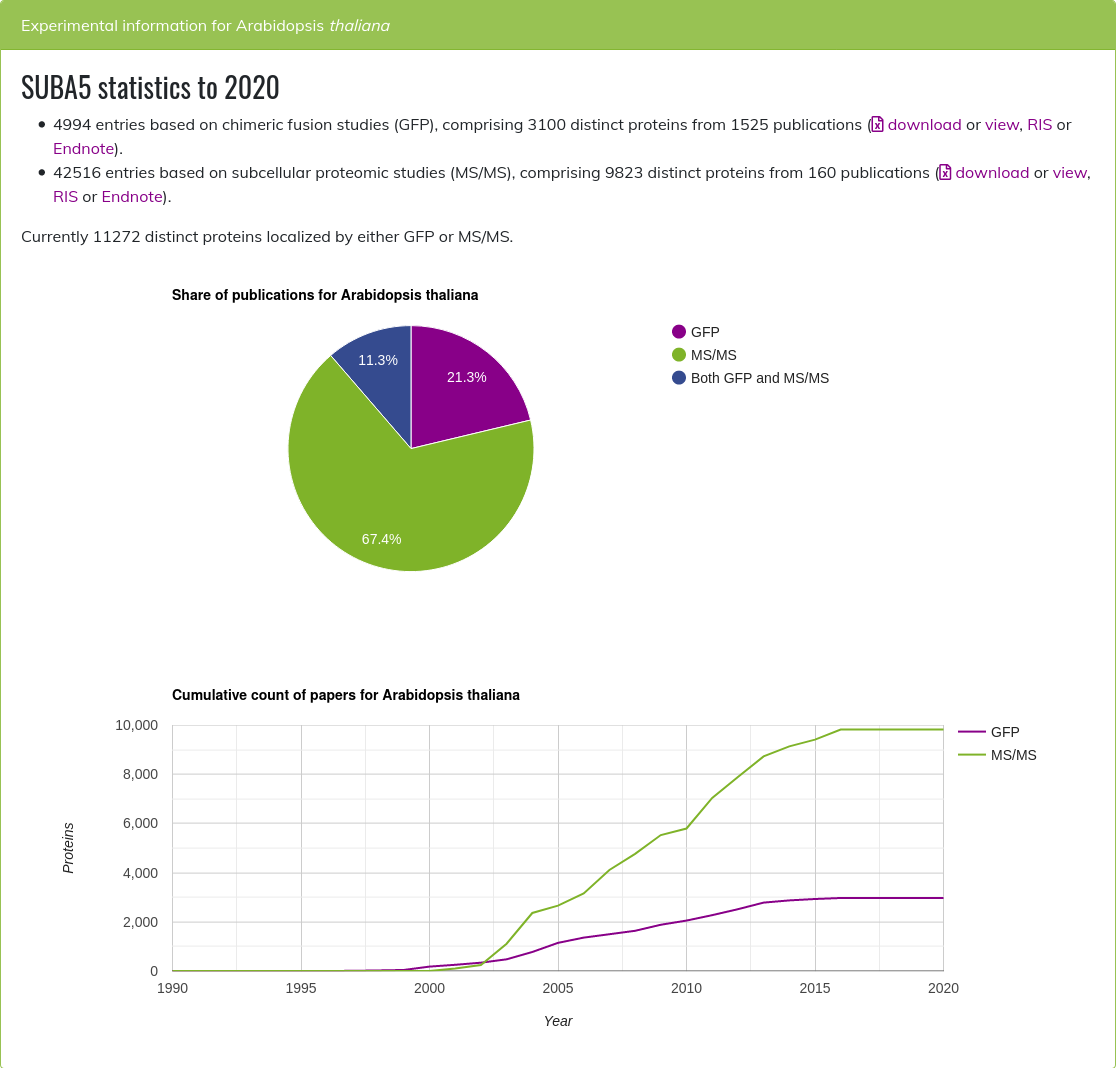
SUBA5 statistics 
You can gain immediate access to the localisation data using the “statistics” button. The display will show the data in SUBA5 accumulating over the year of publication.
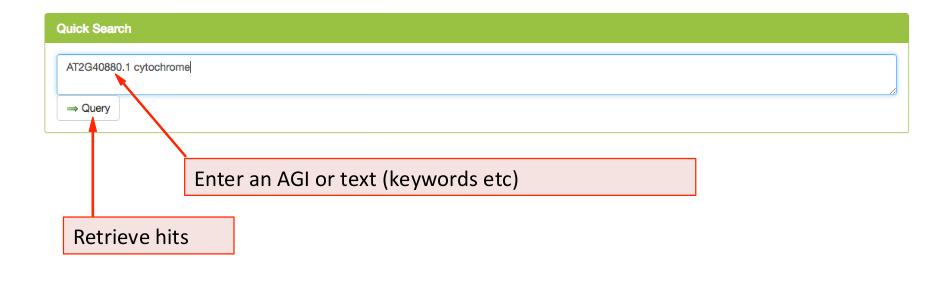
The ‘Quick Search’ panel 
Using the quick search tab, the user can immediately start a search using an Arabidopsis Gene Identifier (AGI) or key words. Pressing the Query button will send the request to the database retrieving any hits for AGIs entered or for matches of the entered key words in protein description derived from TAIR10, titles or abstract of the SUBA5 literature.
The BLAST panel 
The panel labelled ‘Find your closest AGI!’ is a BLAST function, identical to the
one found in the BLAST tab under the search function. The user can enter a
sequence and retrieve data from Arabidopsis proteins with sequence similarity.
The BLAST function will recognize A-Z plus ‘*’. The letters ‘O’ and ‘U’ will be
converted to ‘X’ and ‘N’ will be recognized as ‘unknown’. Gaps in the submitted
sequence will be taken into account such as the best and ‘longest’ sequence
matches are favourable.
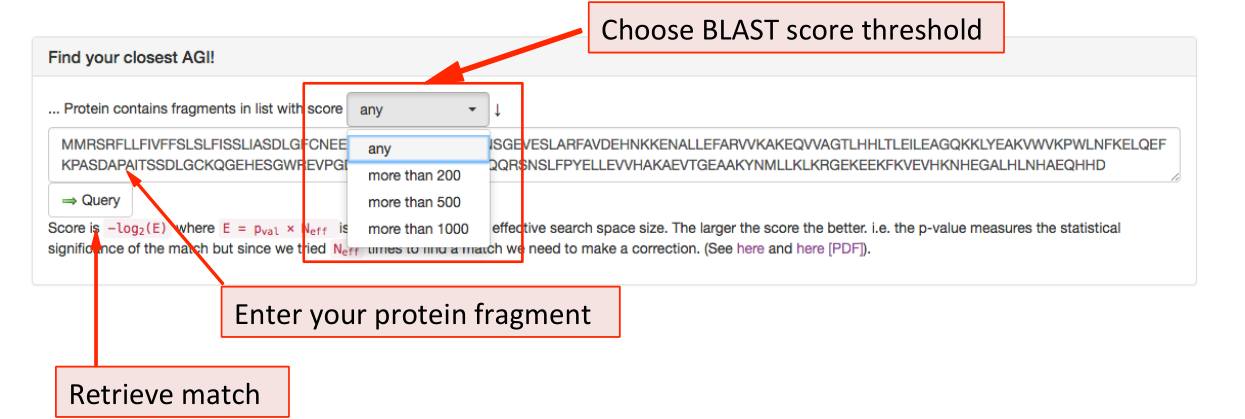
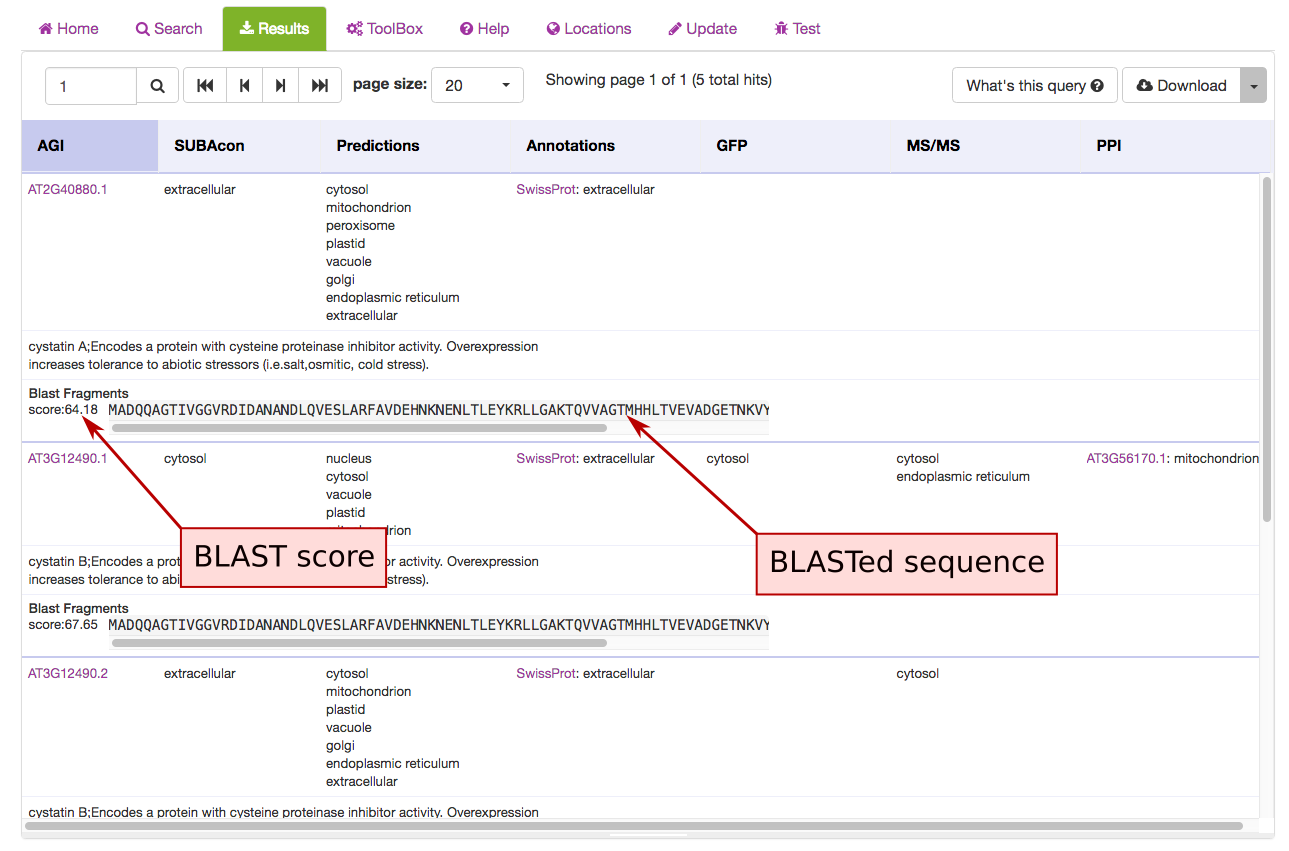
The BLAST hit AGIs are identified and the data for the AGI linked protein are retrieved from SUBA5. The hits are displayed in the results tab and each hit shows the BLAST score and aligned protein sequence below the protein description.
About SUBA5 
The “About SUBA5” contains a collection of descriptions, information and links to additional information about the data, functions and web services in SUBA5.
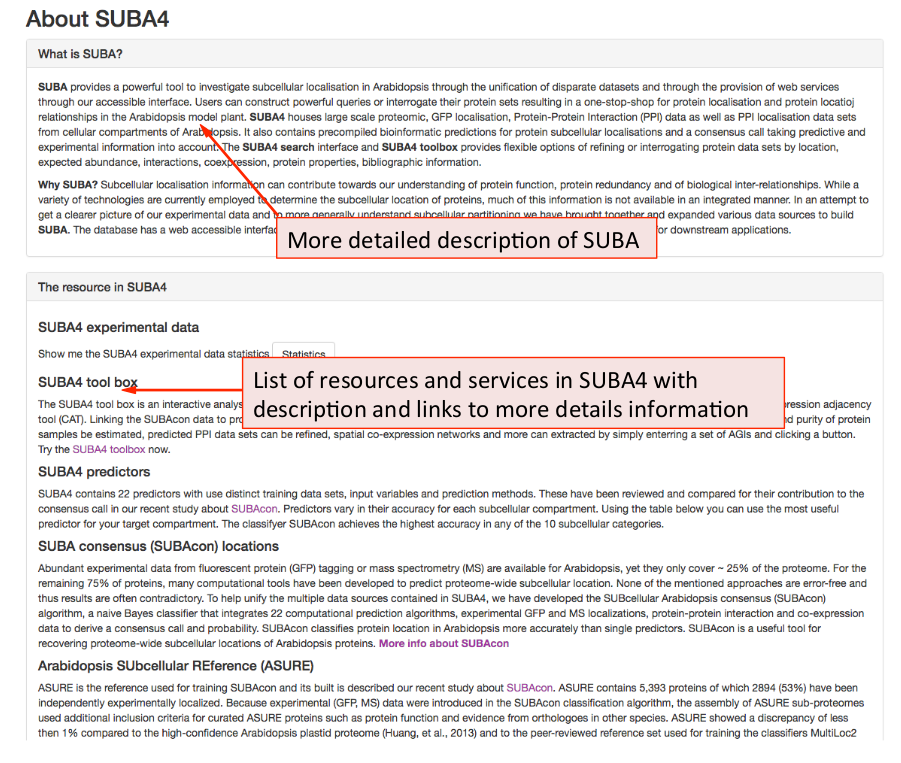
The “What is SUBA5” provides a more detailed description of the purpose, collation and data provision intended by SUBA5. The ‘resource in SUBA5 panel provides a details description of each data set and data tool in SUBA5 including links to affiliated resources.
e.g. The user can find extra information about the predictive data sets. The performance for all predictors and SUBAcon for each compartment is given in the table. This may be useful for users in order to choose a best-suited predictor for their study purpose.
SUBA5 Search Tab 
When clicking on the Search function the tab opens the query builder menu. In
SUBA5 there are more options and categories of queries you can use to
interrogate the SUBA5 data set. In order to enable the user to find the desired
search parameters we have introduced search categories. Each category is stored
under a tab. The user can choose a parameter from any tab and add it to the
query. The query will appear in the query window at the bottom after clicking
button  . Different search categories can be combined using the AND/OR buttons in between parameters above the query window.
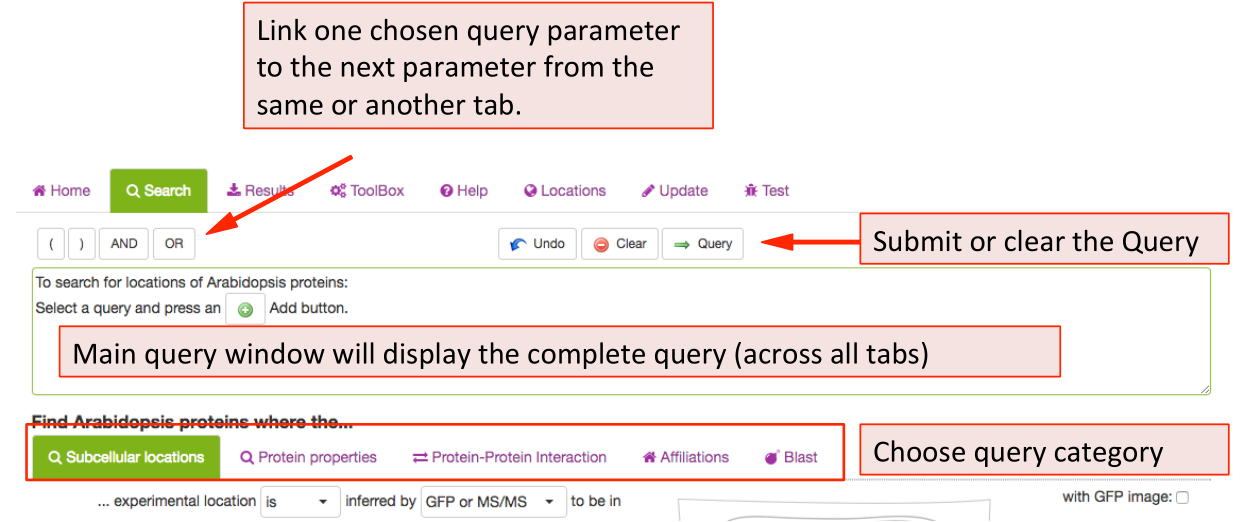
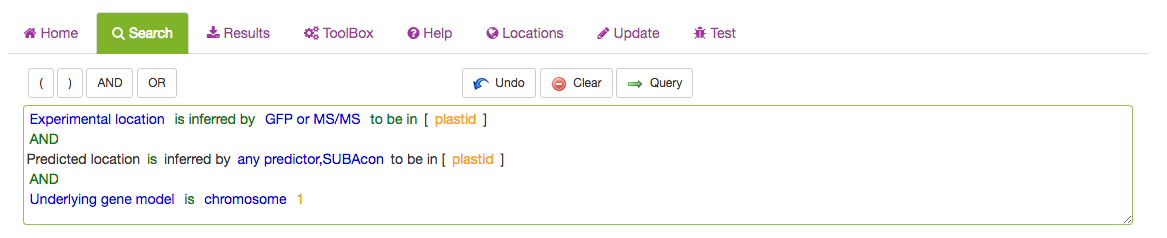
The full query can be seen in the query window. For details about each category please see search category sections in the tutorial below.
Subcellular location Search Tab 
This tab contains queries for limiting proteins based on their localisations. SUBA5 has 2 main categories of localisations. You can search for experimental localisations, which is the top query parameter.
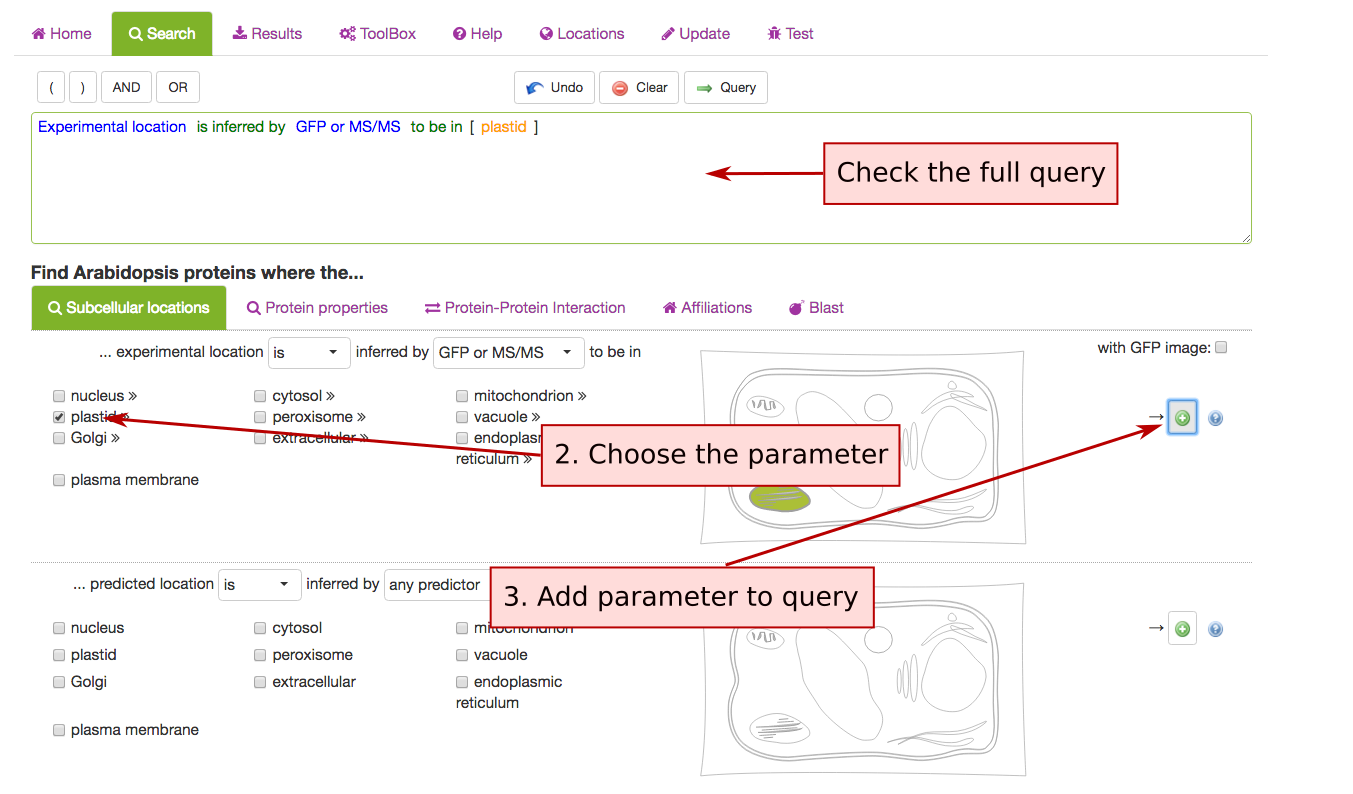
The parameters such as in/exclusion of particular compartments and methodology can be chosen from the drop down lists. For choosing a subcellular location, tick any of the box or structures in the cell schematic for the conventional SUBA location categories. For expanded suborganellar categories, click on the >> to expand the list.
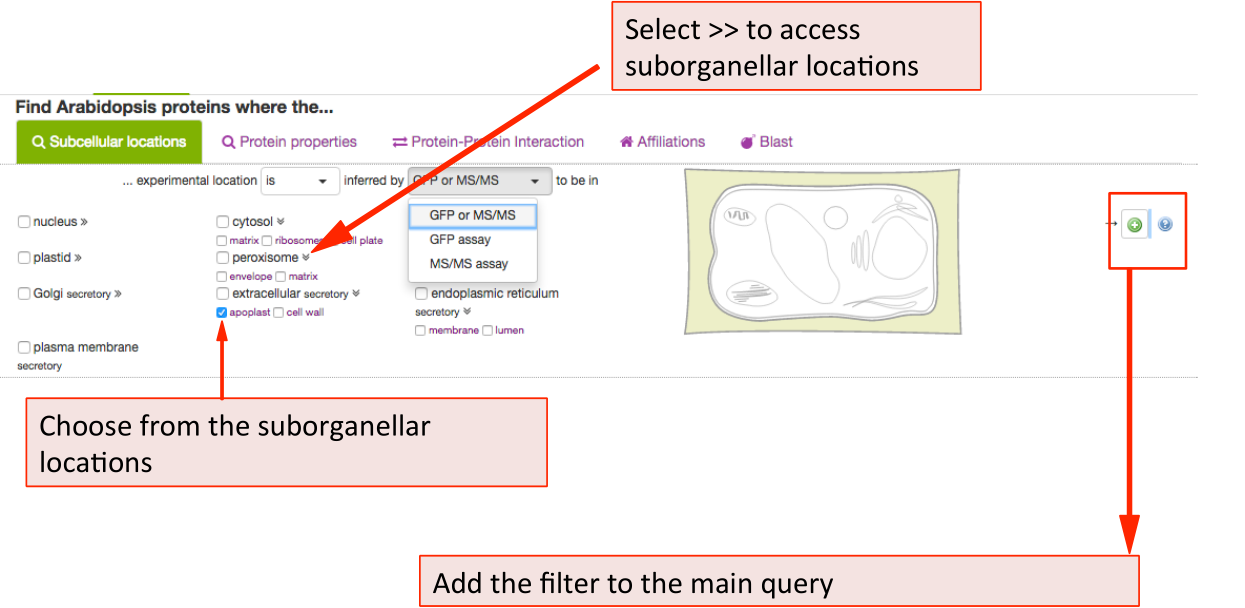
This will maximise the localisation view. Click on the desired location. For
choosing more then one location, keep ticking more boxes. When choosing the
whole compartments (extracellular), this will automatically include the
suborganellar locations (apoplast, cell wall). For only searching for apoplast,
untick extracellular and only tick apoplast. Then add your parameter to the
query by clicking the button.
Similarly, to filter for prediction data choose the inclusion and exclusion and the type of predictor from the drop down list. Through this search option, you can also filter by our consensus call output when choosing SUBAcon.
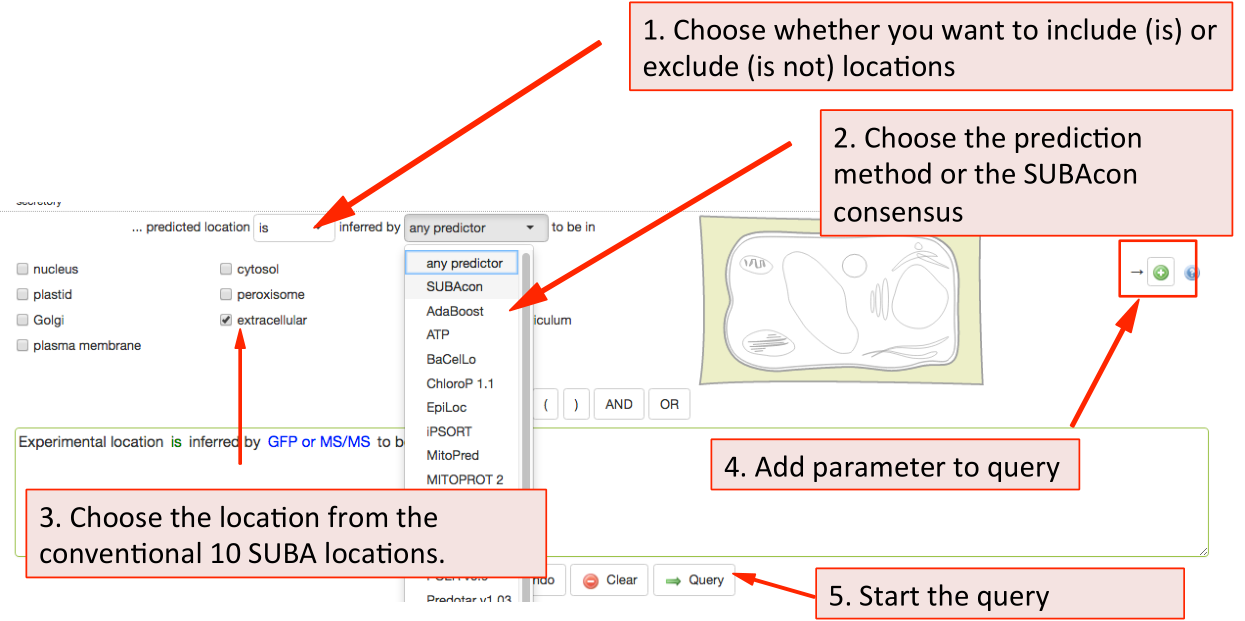
Once you have added all desired parameters to the query window you can check your query and submit it using the Query button. Your retrieved results will be automatically displayed in the Results tab when ready.
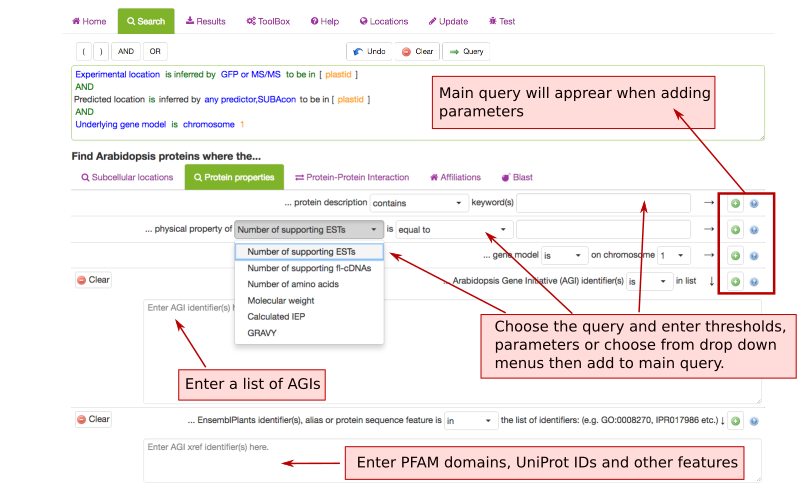
Protein Properties Search Parameters 
The Protein property tab lets you filter SUBA5 data for protein annotations, physical properties and chromosomal locations. This tab also contains the option to enter a list of AGIs or text containing AGIs. A new query in SUBA5 lets you also filter for protein aliases, PFAM domains, EC numbers, pathway annotations, structural features and other annotations.
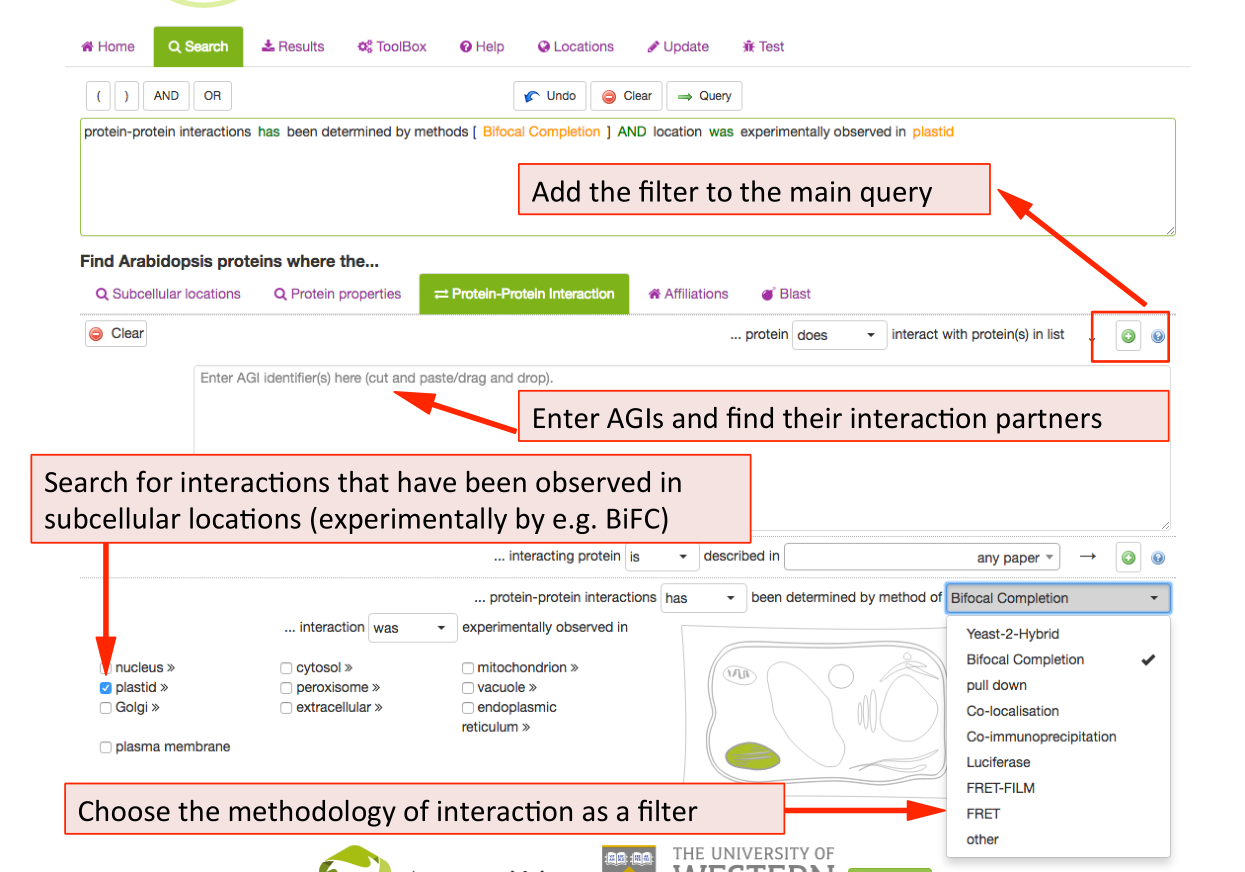
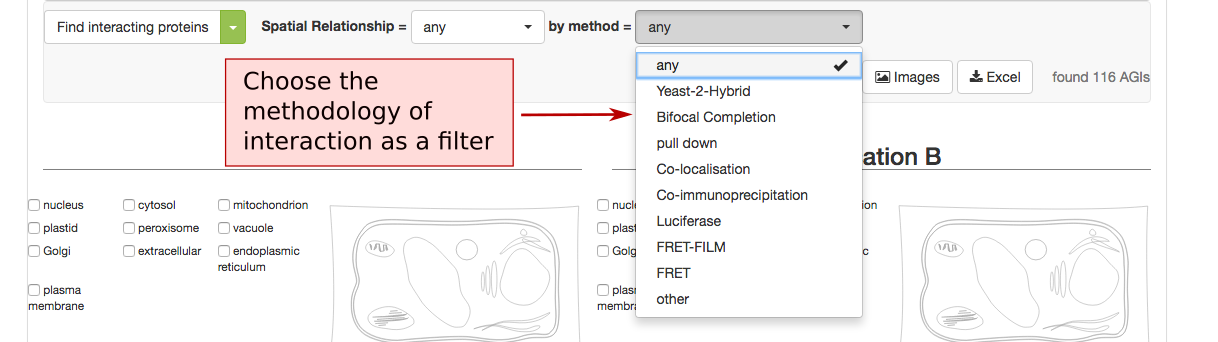
Protein-Protein Interaction Search Parameters 
New in SUBA5: In addition to protein-‐protein interactions (PPI), there are now experimental localisations from observed protein-protein interactions (PPI) such as Bifocal completion Experimentation. The PPI search tab was included to provide a straightforward access to a number of PPI queries. Besides the conventional search for existing PPI partners by entering AGIs, SUBA5 users can now discover PPI proteins that have been experimentally shown to interact in a particular compartment. At the same time, the drop down menu also allows for the choice of PPI methodology. Other search options for PPI data include the isolation of PPI studies.
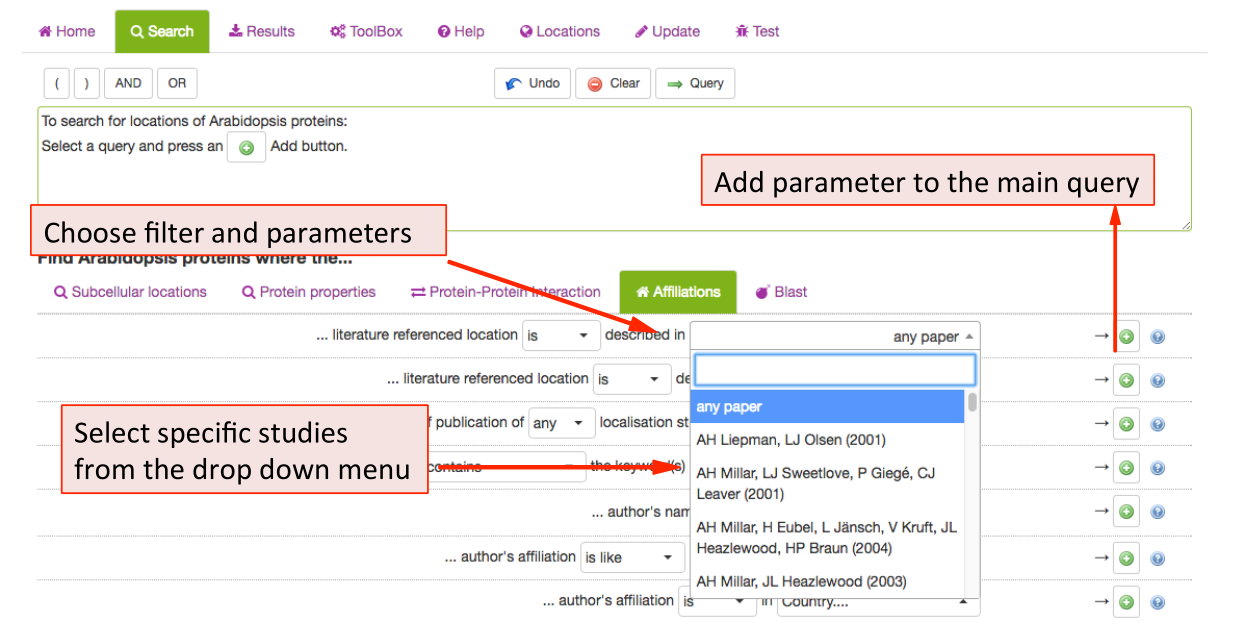
Affiliations Search Parameters 
This tab allows SUBA5 users to find experimental localisation data from specific
authors, institutions, countries or filter by year of publications. To limit the
results a particular study, choose from the publication list in the drop-down
menu. The results can also be filtered by any author (not just first author) as well
as by year or range of years of publication.
For adding any of the parameters to
the main query press the button.
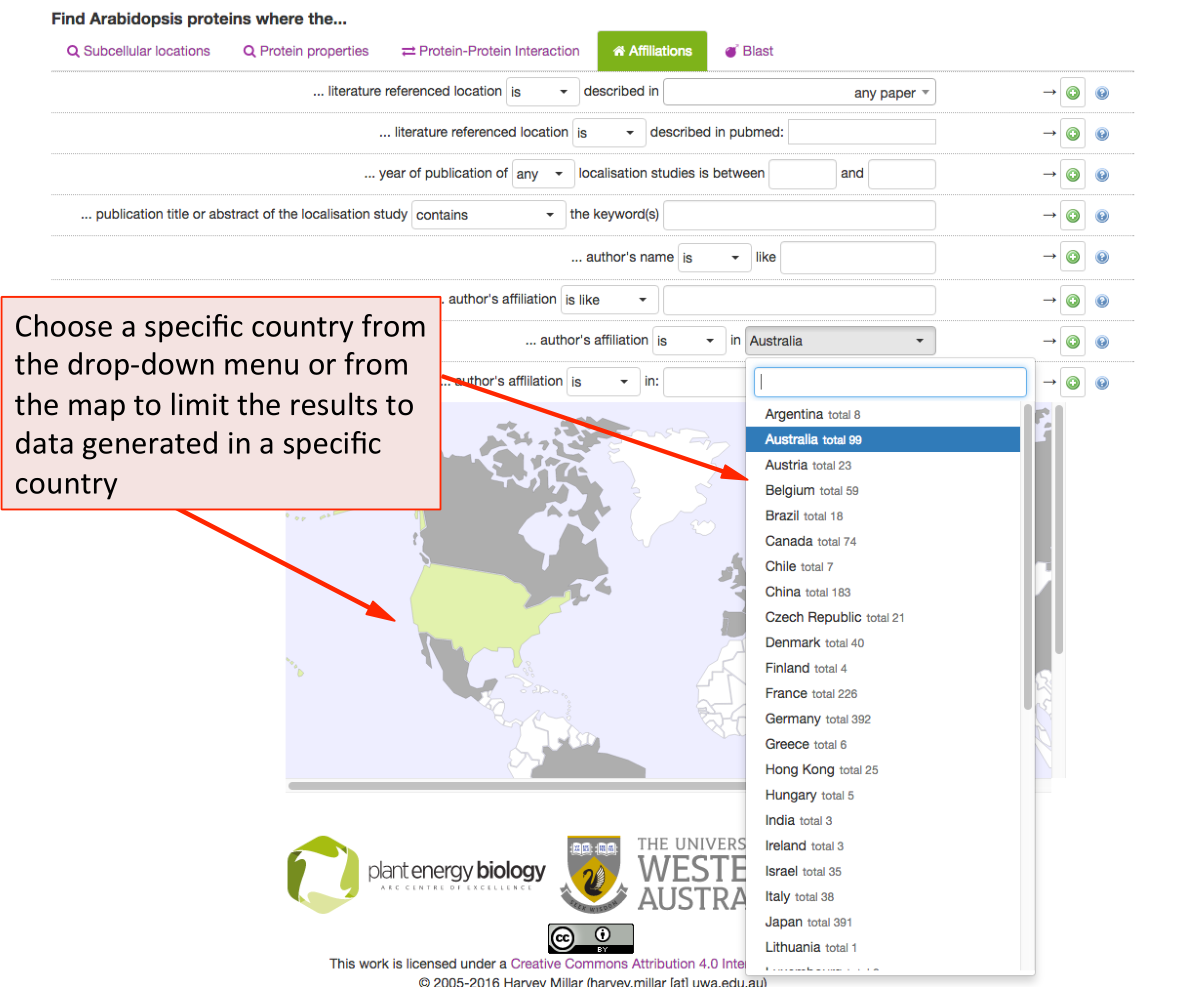
SUBA5 allows the search for data by country of origin of the experimental study. Using the drop-‐down menu shows the countries and number of studies that have contributed to the SUBA5 data set. When using the map for choosing a country, the grey countries indicate a contribution to SUBA5 whereas white countries have not contributed data sets to SUBA5. Green indicates a chosen country.
BLAST Search Parameters 
The BLAST tab contains the BLAST tool equal to the one in the BLAST panel labelled ‘Find your closest AGI!’ on the SUBA5 homepage. The user can enter a sequence and retrieve data from Arabidopsis proteins with sequence similarity. The results can be filtered using the BLAST score as a threshold. The score measures sequence similarity in respect to sequence length. The BLAST hit AGIs are retrieved and the data for the AGI linked protein is retrieved from SUBA5.
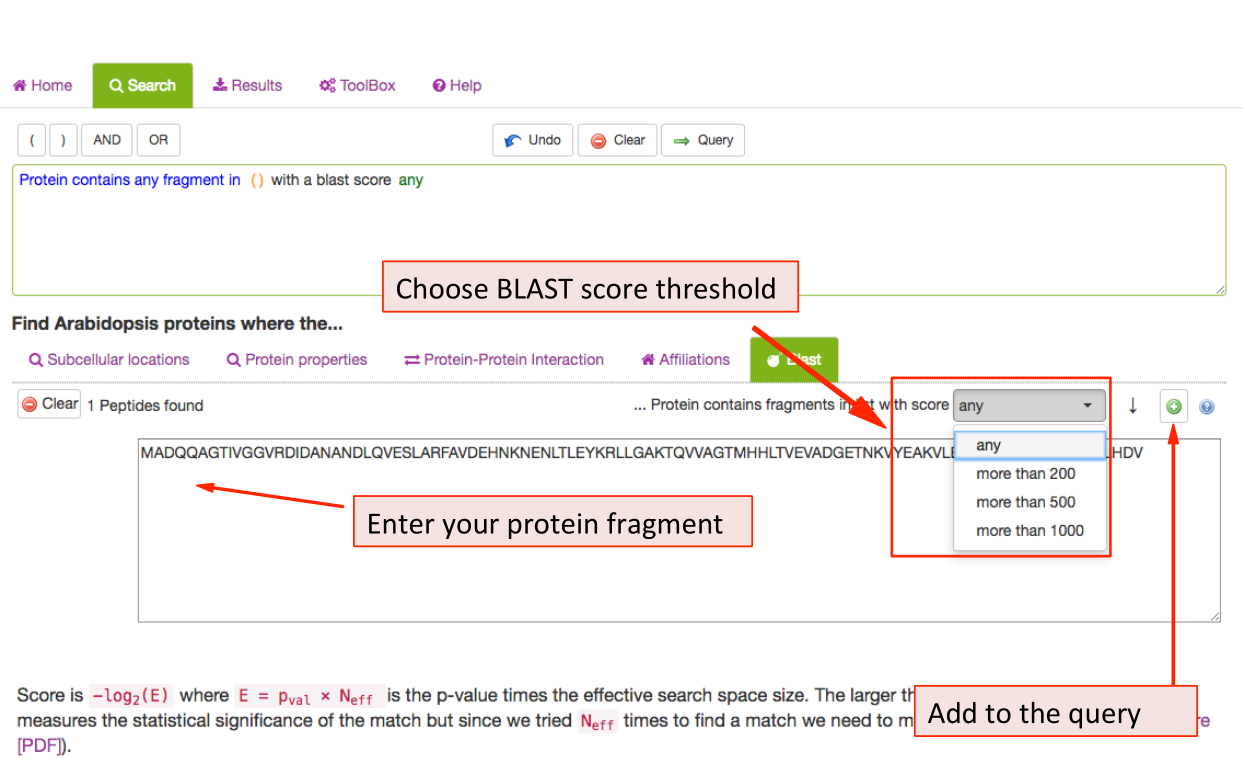
The hits are displayed in the results view and each hit shows the BLAST score and aligned protein sequence.
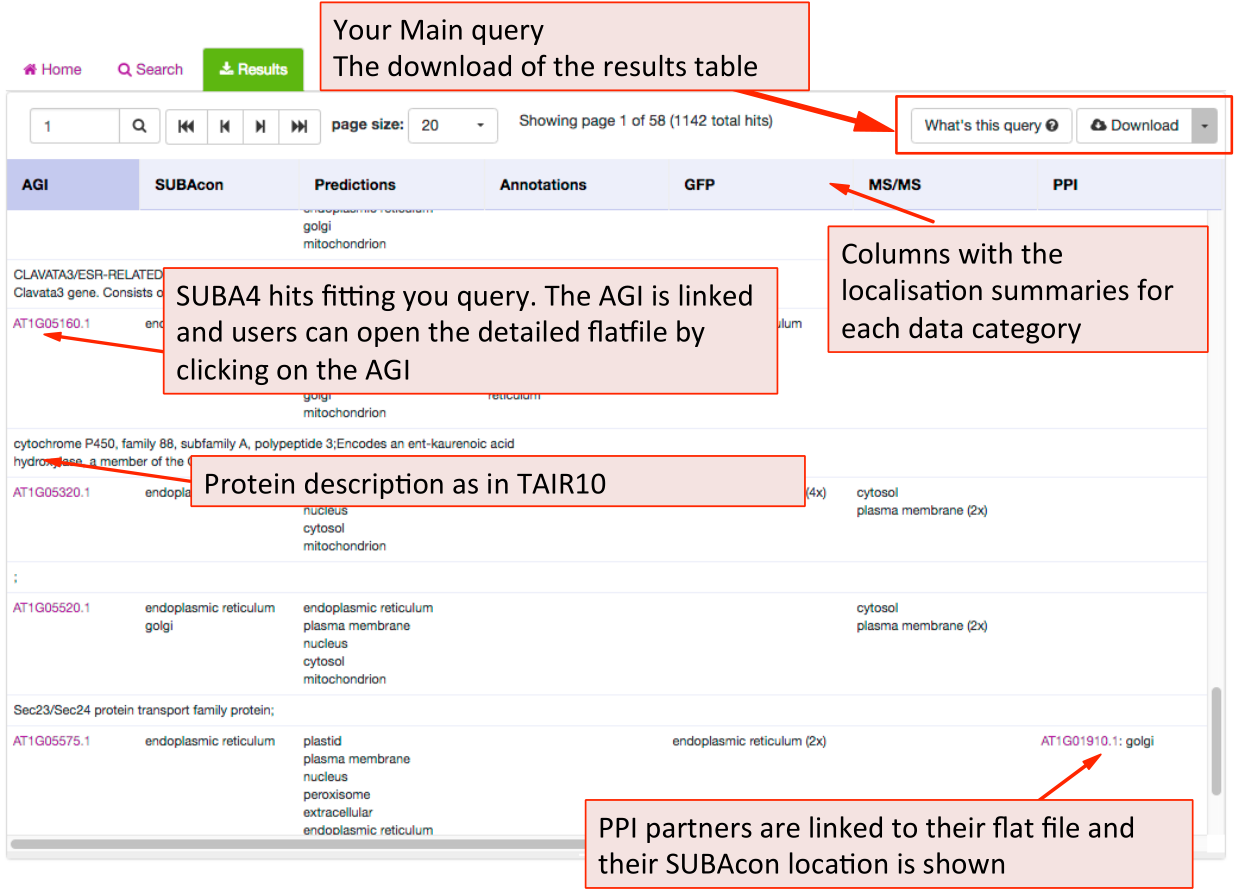
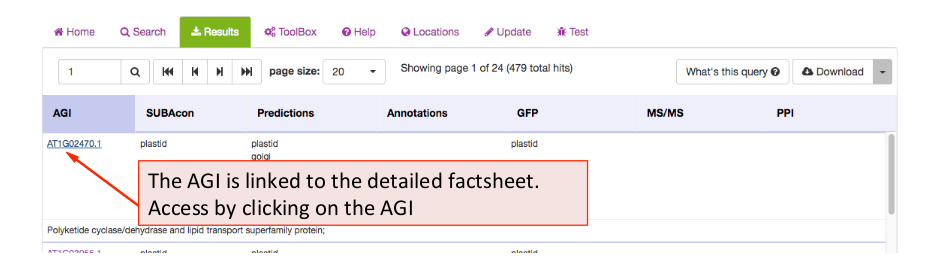
SUBA5 results tab 
The results tab will automatically be activated when the query is submitted. SUBA5 users will be able to see the query by clicking on the “What’s this query” button in the top left. The results can be downloaded as a table format using the download button.
The results are presented in table format. The columns can be customized towards the preference of the user. The first column shows the AGI of the proteins fitting the submitted query and the description for the protein below. This is followed by the consensus call derived from SUBAcon. Each of the individual localisation data columns show the summary of the data for the category. For a more details view for each category the user can access the factsheet by clicking on the AGI.
SUBA5 Toolbox 
The SUBA5 toolbox is a new feature and more detailed description of each tool is currently in preparation for submission. However, this section will provide the user with the information and instruction necessary for use.
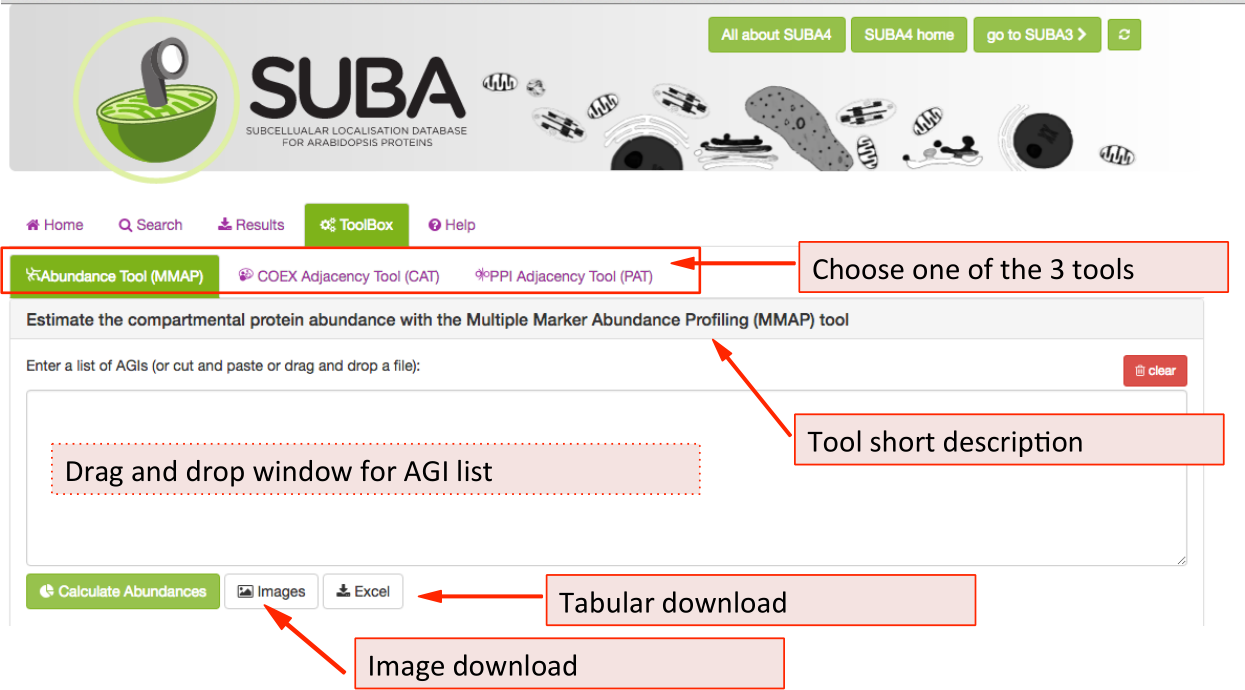
There are 3 tools available in the SUBA5 toolbox. The initial toolbox view shows the front of the MMAP protein abundance tool (tab is highlighted in green). Below the tab index, the heading contains a short description of the main feature of the tool that is currently chosen. To choose another tool e.g. the Coexpression Adjancency tool (CAT), click on the CAT tab. All three tools have the AGI drag and drop window in common where AGIs can be dragged or pasted into. Besides tool-specific search functions, all tools have an image and tabular download function, which are situated underneath the AGI drag and drop window.
The Multiple Marker Abundance Profiling (MMAP) tool 
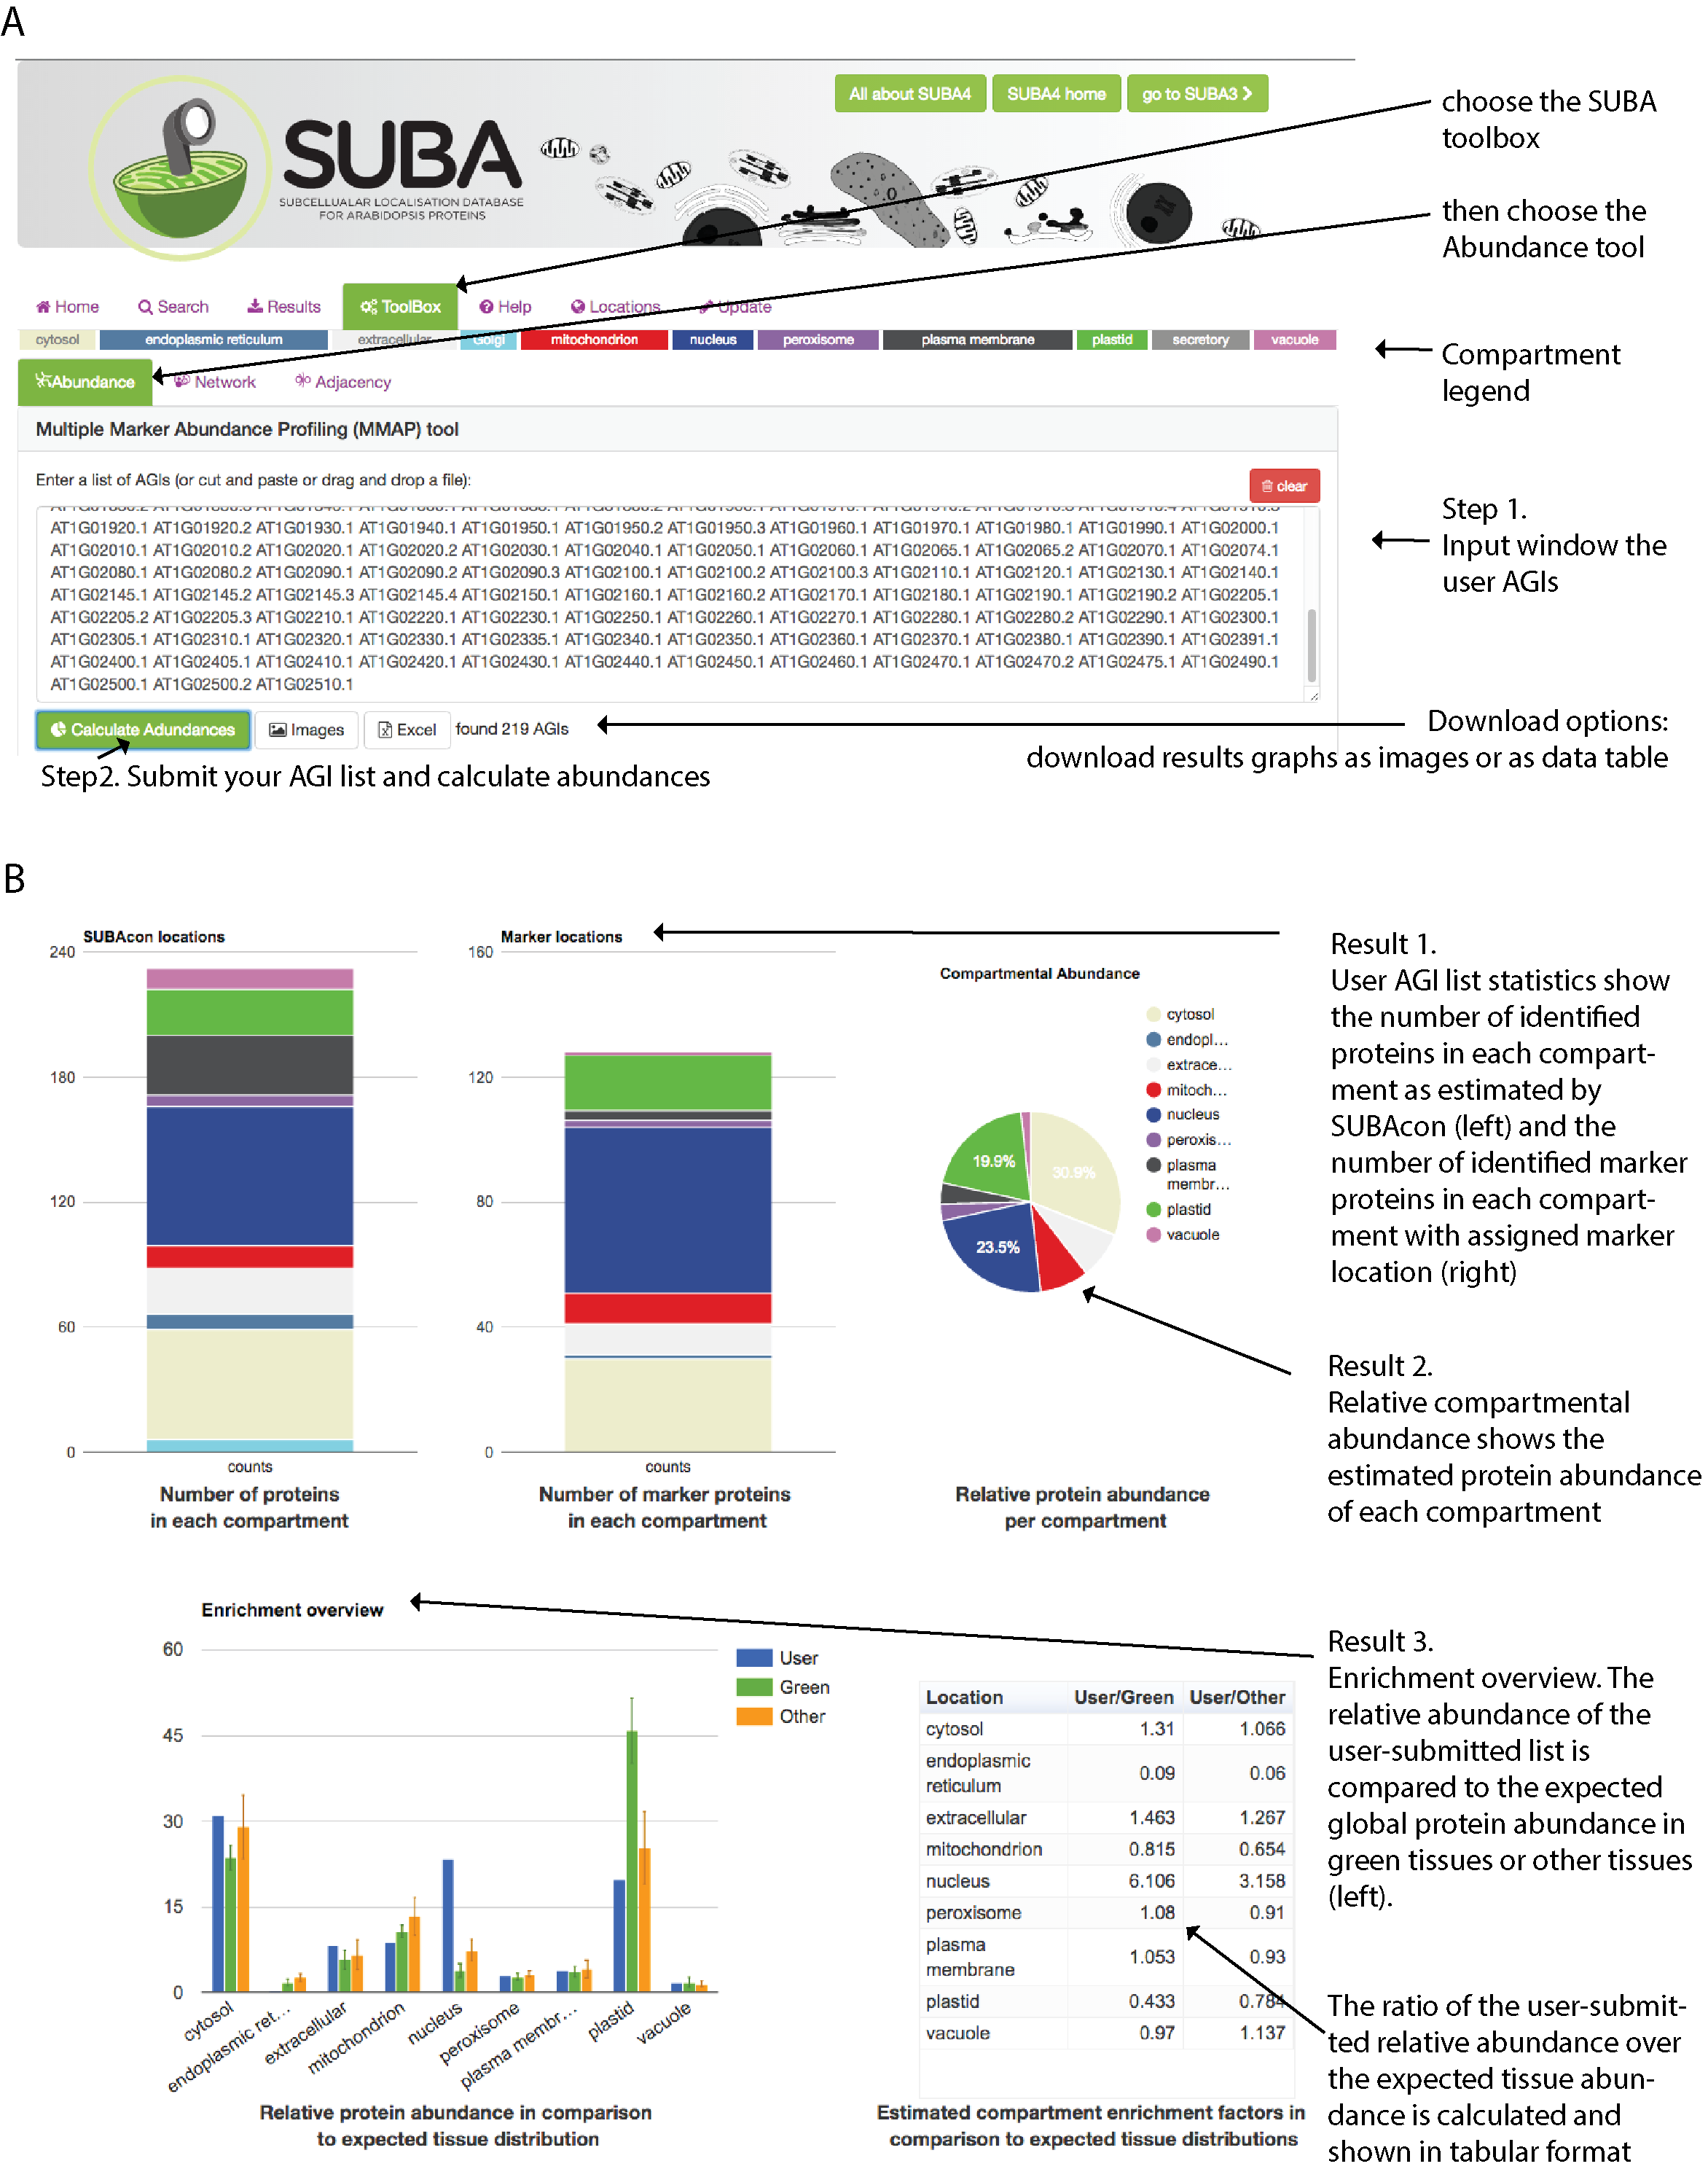
The MMAP tool has been developed to provide a method to estimate compartmental protein abundance without additional experimental data. The relative protein abundance for each protein was estimated from global aggregated and normalized mass spectrometry data in MASCP Gator (https://omictools.com/mascp-gator-tool). A large number of marker proteins with high confidence was assembled for each compartment. When submitting a list of AGIs through the drag-‐and-‐drop window, the marker proteins are identified from the list and the relative abundance is summed for each compartment. This is compared to expected values in green and other non-predominantly photosynthetic tissues that have been estimated by MRM experimentation.
In short: For using this tool, all you need is a list of AGIs that is pasted into the
window. Once you press the calculate abundances button ( ) you receive a number of statistics back from your list.
The Coexpression Adjacency Tool (CAT) 
The coexpression adjacency tool provides spatial analysis statistics for coexpression partners using SUBAcon location calls. The user can drag a list of AGIs in the window on the top and look for coexpressed AGIs either within the list (‘restrict to my list’) or globally. SUBA5 contains the top 300 coexpressed partners and excludes self-coexpressed AGIs (rank = 1). Pressing the ‘Find coexpressed proteins’ or the ‘restrict to my list’ button submits the query and returns the statistics.
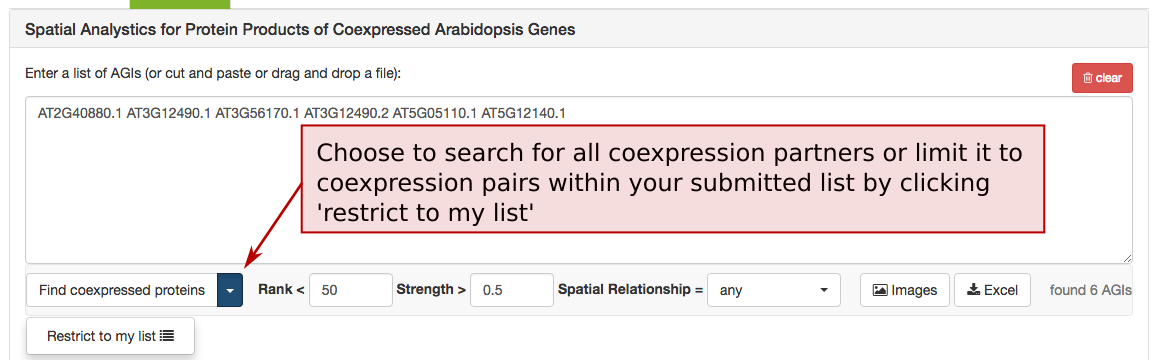
To limit the list of coexpressed partners, the coexpression rank (mutual rank 2-300) and strength (average coexpression coefficient 0-1) can be restricted.
The list of coexpressed AGIs can also be filtered by the spatial relationship of the expressed proteins. The categories include matching, adjacent, distant location pairing as well as secretory for locations exclusively within ER, Golgi, vacuole, plasma membrane and extracellular. Mixed location calls with unclear biological implications are combined into the category unclear.
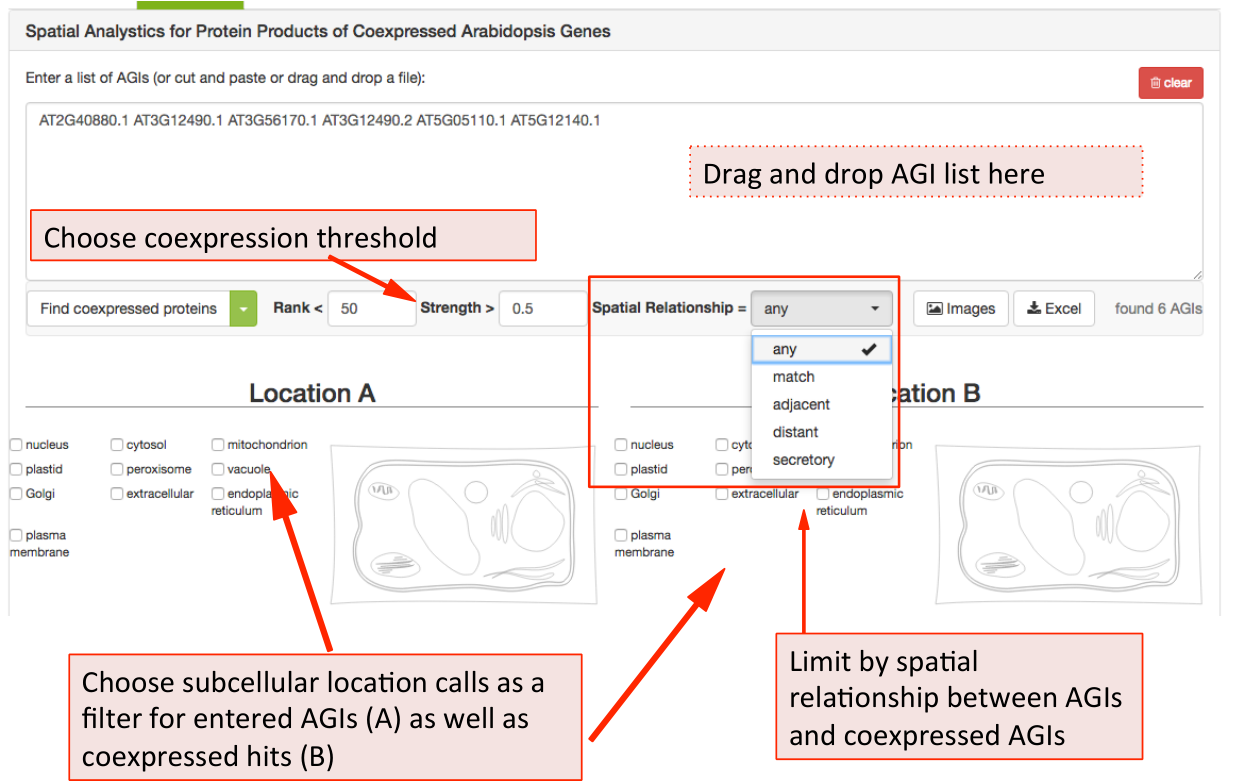
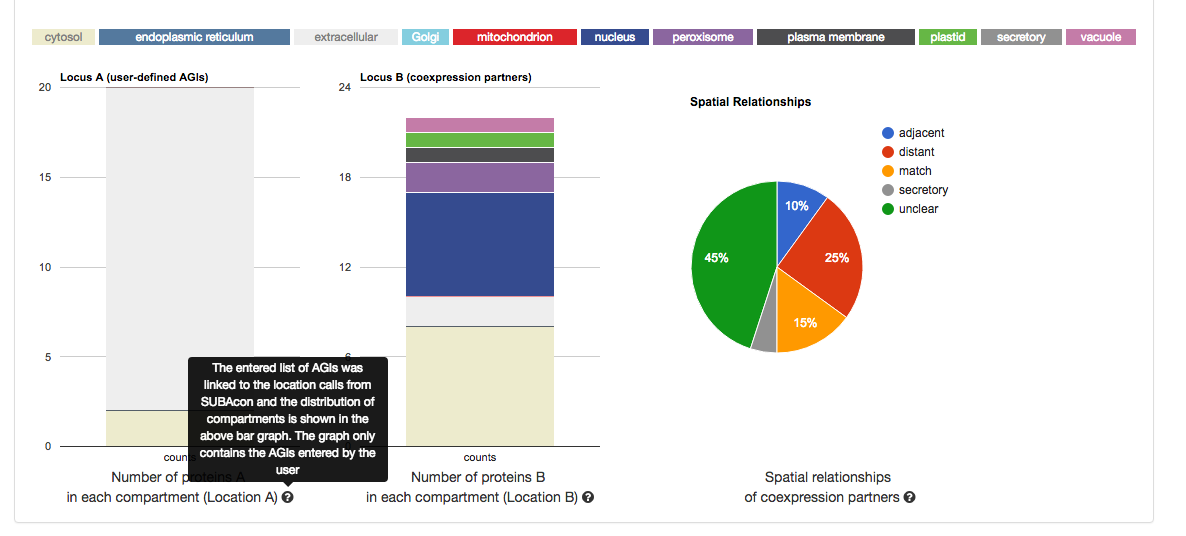
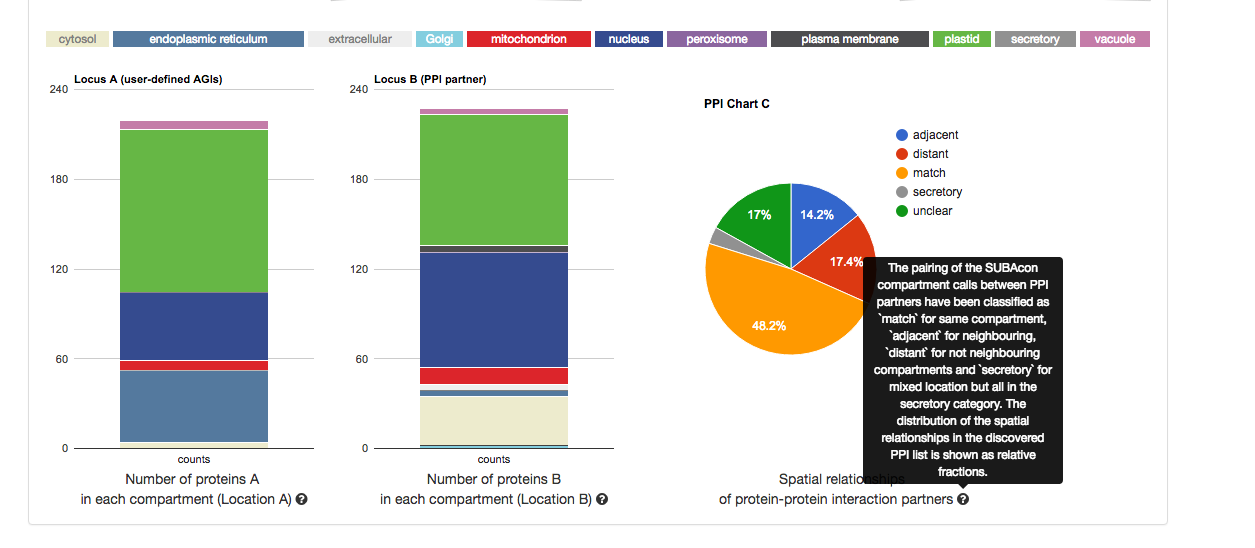
When searching for specific location pairings, the user-submitted list of AGIs can also be specifically limited to location calls for the proteins submitted (location A) and the location calls for the coexpressed proteins (location B) Once submitted, the statistics for your user list will appear in format of 3 graphs.
From left to right, it shows the distribution of the location calls for the user-submitted AGIs (Location A) and the distribution of the location calls for the
retrieved coexpressed AGIs (Location B). If the ‘restrict to my list’ option was
chosen, these distributions may look very similar. The pie chart on the right
shows the distribution of the spatial relationships of the coexpression couples.
This relative measure shows the % of matching, adjacent and distant
compartment PPIs. The information for each graph can be obtained by gliding
over the  question mark behind the x-Axis title below the graph.
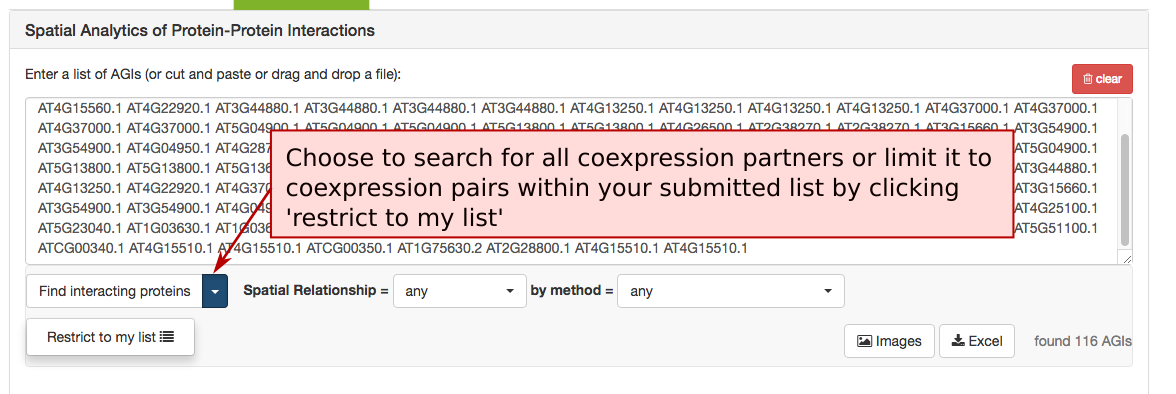
The PPI Adjacency Tool (PAT) 
The Protein-‐Protein Interaction (PPI) adjacency tool provides spatial analysis statistics for PPI partners using SUBAcon location calls. The user can drag a list of AGIs in the window on the top and look for PPI partners either within the list (‘restrict to my list’) or globally. SUBA5 contains a set of experimentally verified PPI proteins that is searched through this tool. Pressing the ‘Find interacting proteins’ or the ‘restrict to my list’ button submits the query and returns the statistics.
The PPI retrieval can be limited by the locations in two different ways. Firstly the user can choose to only view PPI proteins which have PPI partners in the same (match), neighbouring (adjacent) or non-neighbouring (distant) compartments. For PPI partners within the secretory but not matching (e.g. ER – Golgi), the category ‘secretory’ was introduced. This may help identify functionally related proteins within the PPI cohort.
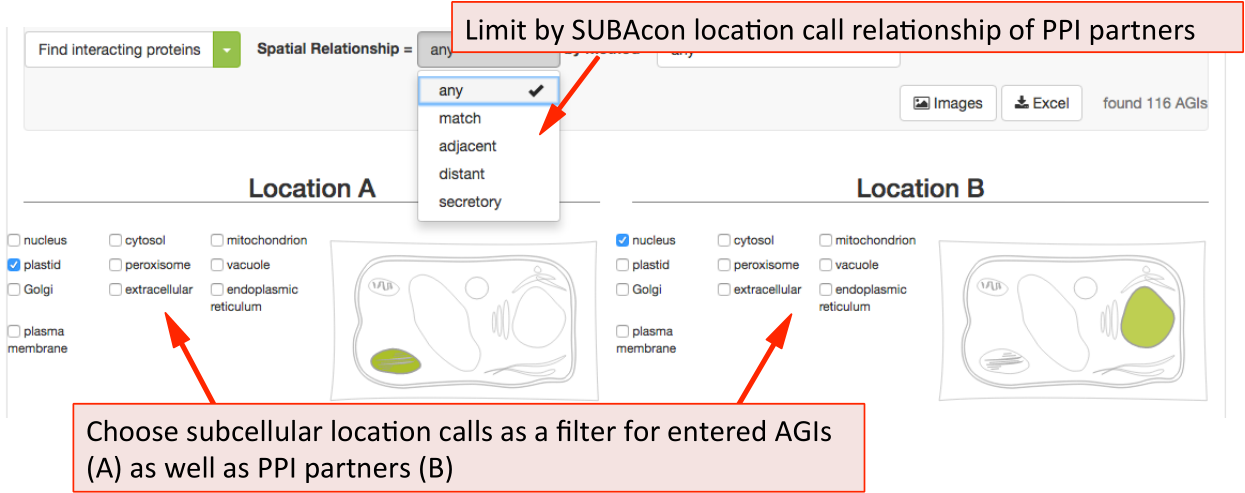
The list of proteins can also be refined using the type of methodology that was used to identify the PPI. This includes Yeast-2-hybrid, immune co-precipitation, bifocal completion and other methodologies that can be chosen from the drop down menu.
Once submitted, the statistics for your user list will appear in format of 3 graphs.
From left to right, it shows the distribution of the location calls for the user-submitted AGIs (Location A) and the distribution of the location calls for the
retrieved PPI AGIs (Location B). If the ‘restrict to my list’ option was chosen,
these distributions may look very similar. The pie chart on the right shows the
distribution of the spatial relationships of the PPI couples. This relative measure
shows the % of matching, adjacent and distant compartment PPIs. The
information for each graph can be obtained by gliding over the question mark
behind the x-Axis title below the graph.
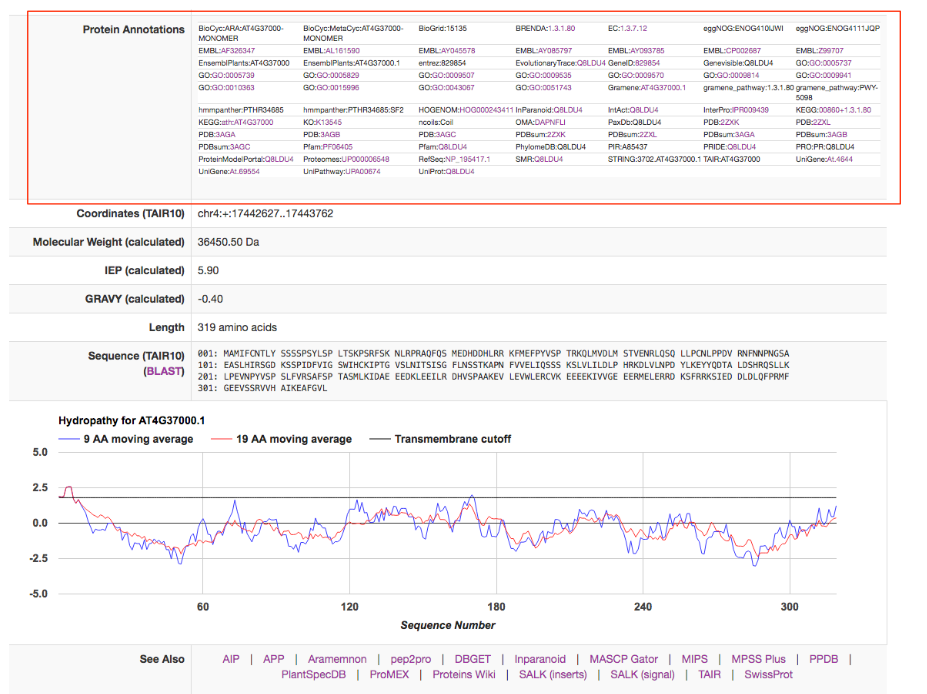
The SUBA5 factsheet 
Each protein in Arabidopsis has a SUBA5 factsheet that contains all the details about the protein properties, affiliated studies and localisations. The Factsheet can be accessed by clicking on the AGI in the results tab.
The top of the factsheet contains a widespread view of the localisation information. The left column contains the consensus that if formed by the Algorithm SUBAcon (red box). This takes into account the predicted as well as experimental localisation data. SUBAcon was trained using the subcellular reference standard ASURE. If the protein you are looking was part of the reference standard, this will appear as well.
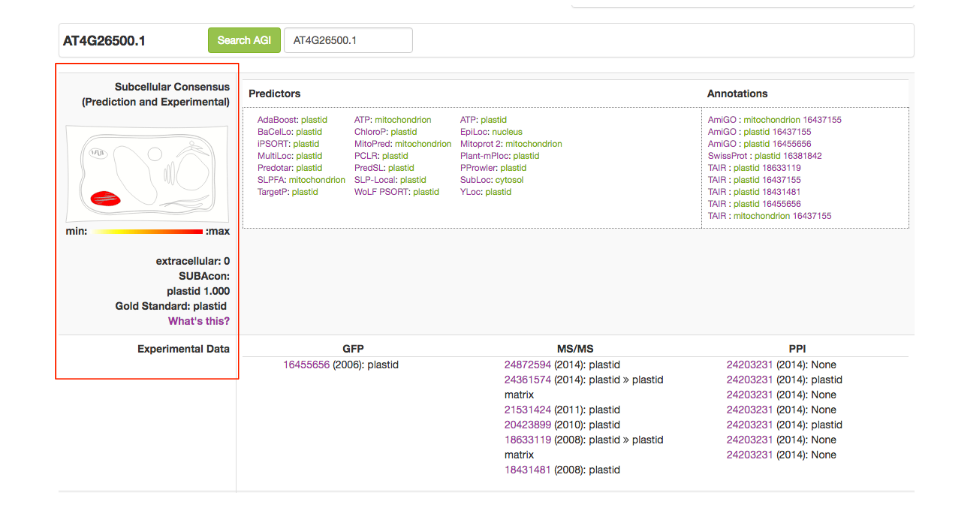
The top row displays the predictor outputs for any of the 22 predictors if there is one. If a predictor does not cover your protein, it will not appear. On the right you find the Annotations retrieved from other database resources.
The second row contains the experimental localisations including GFP localisations, MSMS localisations and PPI partners with localisations if available.
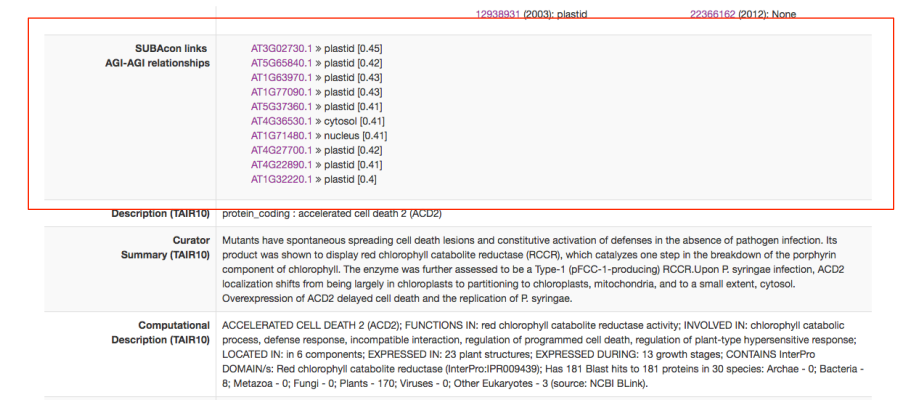
In the next row you find the AGI-AGI relationships. This is a selection of the top 10 coexpressed AGIs of your protein and the SUBAcon location call as well as the average coexpression coefficient (in red box). Below you find the protein name, description and any curator comments available through TAIR 10.
A new feature in SUBA5 is the Annotation box. This box contains a list of annotations from other data resources including functional domains, aliases, pathway annotations, enzyme annotations and others. Most of them are linked to their respective resource where more information about the annotation can be obtained.